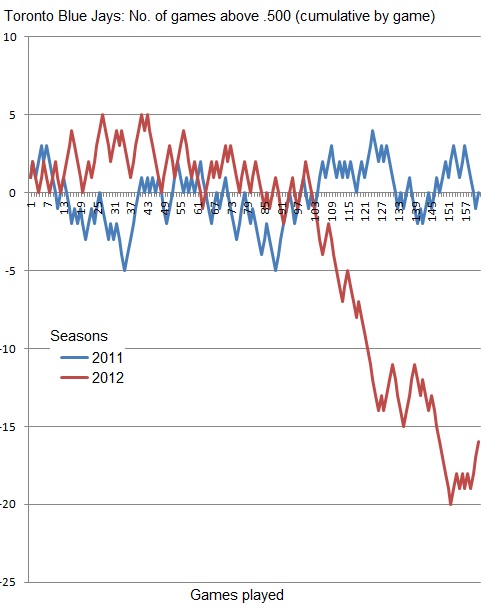
I made these Microsoft Excel charts to compare the Blue Jays' seasons (to be updated after each successive season).
The 2011 and 2012 seasons were managed by John Farrell. Note the 2012 team's steady slide after game 100, soon after Bautista went on the DL for most of the rest of the season. John Gibbons will manage for 2013.
Below: Wins.
Below: Winning percentage.
Below: Games above .500.
Below: Winning percentage by season, from the team's inception. Note the decline after their World Series wins in 1992 and 1993.
Showing posts with label American League East. Show all posts
Friday, December 14, 2012
AL East team stats (2012 season)
Here are some MLB-related charts that I made using Microsoft Excel, showing and comparing each American League East team's 2012 season wins, winning percentage, and games above .500.
Below: Wins.
Below: Winning percentage.
Below: Games above .500.
Below: Wins.
Below: Winning percentage.
Below: Games above .500.
Subscribe to:
Posts (Atom)


